| Phone |
| |
| |
| 대표전화 |
1577-7956 |
| 본 사 |
031-457-9187 |
| 대 전 |
042-932-1265 |
| |
|
| Web Site Visitors |
| |
| |
| Today |
574 |
| Yesterday |
1364 |
| Since 2006 |
2,413,695 |
| |
|
 |
|
| 영진코퍼레이션 종합카다로그 |
|
|
Introduction
인간 신경계를 침범하는 질병을 연구하는 데 있어 주요 장애 요소는 human phenotype 을 정확하게 반영하는 신경 세포 집단의 활동을 모니터링, 분석 및 정량화하는 능력입니다.
이러한 한계는 인간 환자 조직에서 유래한 세포에 대한 접근성이 극히 제한적이며, 신경 세포의 기능적 측정을 충분한 처리량으로 수행하여 완전한 phenotypic characterization 을 규명할 수 있는
맞춤형 장비가 부족하기 때문에 발생합니다.
세포 리프로그래밍 기술 (cellular reprogramming technologies) 의 발전으로 인해, 인간 유도 만능줄기세포 (hiPSC) 를 뇌에서 발견되는 다양한 세포 집단 (예: 신경 세포, 신경교 세포, 면역 세포 등) 으로
분화시키는 프로토콜 개발에 대한 연구가 활발히 이루어졌습니다. 그 결과, 도파민성, GABA성, 글루탐산성, 말초 신경 세포 등 여러 가지 신경 세포 모델이 생성되었지만,
대부분 아직 충분히 특성화되지 않았습니다. 이에 따라 시험관 내(in vitro) 세포 모델을 더 깊이 이해하고, 이를 개선할 방법을 찾는 것이 필요합니다.
이 Application Note 에서 설명하는 Incucyte® Live-Cell Analysis System 의 기술, 방법론 및 응용 분야는 이러한 문제를 해결하기 위해 설계되었습니다.
즉, 연구자들에게 자동화된 도구를 제공하여 복잡한 신경 모델의 평가, 특성화 및 검증을 용이하게 할 수 있도록 돕는 것이 목표입니다.
Assay Principle
신경 세포의 형태적 특징 (예: 신경 돌기 성장) 을 측정하면 그 구조에 대한 통찰력을 얻을 수 있지만, 신경 활동의 분석 (neuronal activity assays) 은 신경 세포의 기능,
다른 신경 세포와의 시냅스 연결 형성 방식, 그리고 환경에 대한 반응을 보다 정교하고 심층적으로 이해할 수 있도록 해줍니다.
이 Application Note 에서는 장기간 신경 활동을 측정할 수 있는 통합 솔루션을 소개합니다. 이 솔루션은 Incucyte® Neuroburst Orange Lentivirus,
신경 세포 특이적 유전자 발현 칼슘 지시자 (GECI, Genetically Encoded Calcium Indicator), 그리고 Incucyte® Live-Cell Analysis System을 활용하여 구성됩니다.
해당 시스템은 Orange/NIR 또는 Green/Orange/NIR 광학 모듈이 장착된 형태로 사용할 수 있습니다.
또한, Incucyte® Neuronal Activity Software Module 에서 제공하는 통합 분석 도구를 이용하면, 배양된 수천 개의 기능성 신경 세포에서 칼슘 진동(calcium oscillations) 을 자동으로 정량화하고,
신경 세포의 형태 변화를 장기간 (수일, 수주, 수개월) 모니터링할 수 있습니다(그림 1).
이러한 접근 방식은 연구자들에게 세포 간 네트워크 연결이 언제, 어떻게 형성되는지를 보다 잘 이해할 기회를 제공하며, 환경적 요인 (예: 약물 처리, 기질 세포, 배양 배지 조성 등) 이
신경 세포의 행동에 미치는 영향을 규명하는 데 유용한 정보를 제공합니다.

Figure 1 : IncuCyte Neuronal Activity Assay Workflow
The Incucyte ® Neuronal Activity Assay allows for measurements of long-term synaptic activity
from neuronal cell models in physiologically relevant conditions. The assay provides an end-to-end solution
consisting of reagents, protocols, instrumentation, and software for a user-friendly workflow.
Incucyte® Live-Cell Analysis System 의 User Interface 는 96 well plate 내 각 well 에서 신경 활동을 시각화하도록 설계되었습니다.
각 스캔은 30~180초 동안 Stare Mode 를 사용하여 세포 활동을 초당 3프레임의 속도로 촬영하는 방식으로 진행됩니다.
획득된 Stare Mode 영상은 단일 범위 (range) 이미지로 변환되어 간단한 시각적 확인이 가능합니다 (Figure 2B).
이 이미지는 지정된 스캔 시간 동안 배양된 각 세포에서 감지된 강도 범위를 나타냅니다.
이 이미지를 활용하여 자동 이미지 분할 도구(image segmentation tools) 를 사용하면 각 웰에서 활성화된 세포 (active objects, cells) 를 식별할 수 있습니다 (Figure 2C).
이후, 개별 세포의 형광 강도 변화 (fluorescent intensity changes) 를 기반으로 각 세포의 강도 변화 그래프(intensity traces)가 생성됩니다(Figure 2D).
일반적으로 스캔은 24시간마다 한 번씩 수행되며, iPSC 에서 유래한 iCell® GlutaNeurons (Cellular Dynamics) 의 샘플 데이터를 보면, 네트워크 성숙도(network maturity) 에 따라
배양 내 활동이 날마다 크게 변화하는 것을 확인할 수 있습니다.
예를 들어, 배양 4일 차(Day 4) 에는 활동이 거의 없었으나, 7일 차 (Day 7) 부터 점진적으로 증가하였고, 12일 차 (Day 12) 및 17일 차 (Day 17) 에서는 고도로 동기화된 활동이 관찰되었습니다.
수집된 데이터는 각 웰과 각 스캔 시간별로 자동으로 계산된 여러 지표 (automated metrics) 를 포함하며, 이를 통해 실험 기간 동안의 지표 변화 추이를 간편하게 시각화할 수 있습니다(Table 1).
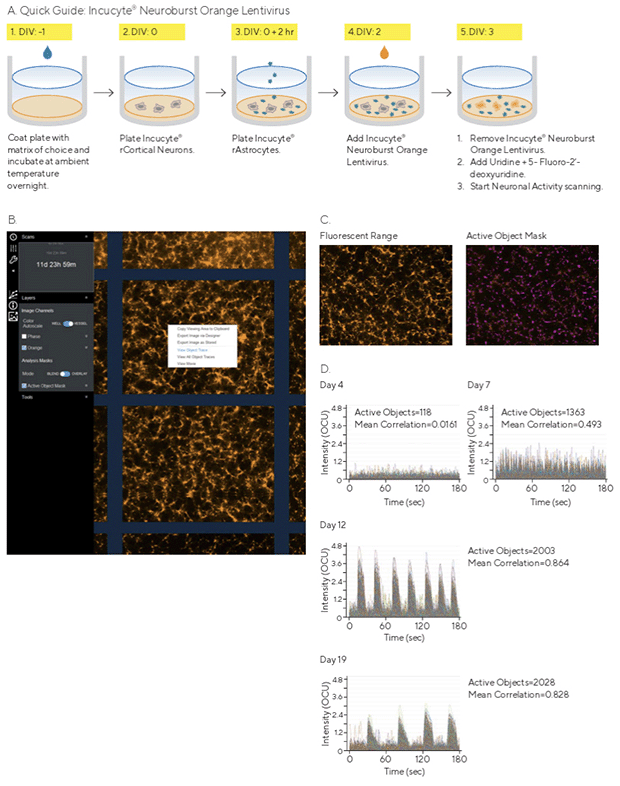
Figure 2 : IncuCyte Neuronal Activity Assay Protocol and Purpose-built Software
Quick guide workflow of Incucyte® Neuroburst Orange Lentivirus infection protocol (A).
The Incucyte® Neuronal Activity Analysis Software Module user interface is capable of displaying object traces, viewing movies,
and longitudinal data of neuronal activity from each well (B). Fluorescent range image and automated segmentation mask of each active object represents
a snapshot of activity over the complete scan (C). An example of iCell® GlutaNeuron calcium traces from each 3 minute scan indicate
changing neuronal activity (fluorescence intensity) over 17 days in culture (D).
| Table 1: Neuronal Activity Analysis Metrics |
|
|
|
| Metric |
|
Description |
|
|
|
| Active Object Count (1/image) |
|
The number of objects (cells/cell clusters) that burst at least once above the Minimum Burst threshold over the total scan time. |
|
|
|
| Mean Intensity (OCU) |
|
The mean intensity of an object over the total scan time. All objects within the image are calculated individually, then values are averaged. |
|
|
|
| Mean Correlation |
|
Every object is compared to every other object in the image to generate a value between -1 and 1, with 0 being completely random and 1 being highly synchronized. This is a measure of network connectivity. |
|
|
|
| Mean Burst Duration (sec) |
|
The duration of each calcium burst over the total scan time is calculated individually, then values are averaged. |
|
|
|
| Mean Burst Rate (1/min) |
|
The number of calcium bursts over the total scan time divided by the scan time in min. |
|
|
|
| Mean Burst Strength (OCU) |
|
The area under each calcium burst divided by the duration of that burst is calculated individually, then values are averaged. |
|
|
Results
Optimization of Incucyte® Neuroburst Orange Lentivirus
E18 초기 배아 단계의 생쥐 뉴런 (Primary Rat Neurons, E18) 을 생쥐 성상세포 (astrocytes) 와 공동 배양하는 것은 신경 활동을 연구하는 데 널리 검증된 모델로 사용됩니다.
본 실험에서는 E18 생쥐 대뇌 전뇌 뉴런을 일정한 수의 생쥐 성상세포(15K/well)와 함께 배양하면서 뉴런의 밀도를 5K~40K/well 범위로 점차 감소시키며 실험을 진행하였습니다.
Figure 3A 에서 확인할 수 있듯이, 형광 강도 (fluorescence intensity) 는 세포 밀도와 강한 상관관계를 보였으며, 가장 높은 신경 활동은 40K 뉴런/well 에서 관찰되었습니다.
이 형광 강도 분포 이미지 (range image) 는 연구자가 형태학적 변화 (morphology), 세포 독성 (toxicity), 그리고 유전자 도입 (transduction efficiency) 여부를 정성적으로 평가할 수 있도록 도와줍니다.
뉴런 활동을 나타내는 Ca²+ 신호의 시간적 변화 결과 (Trace) 는 각 well에서의 신경 활동을 정량적으로 평가하는 데 사용되었으며, 뉴런 밀도는 각 스캔에서 신경 활동을 시각적으로 최적화하는 데 적절한 수준이었습니다 (Figure 3B).
또한, 전체 12일 실험 기간 동안 활성화된 개체를 검출하는 데에도 효과적이었습니다 (Figure 3C).
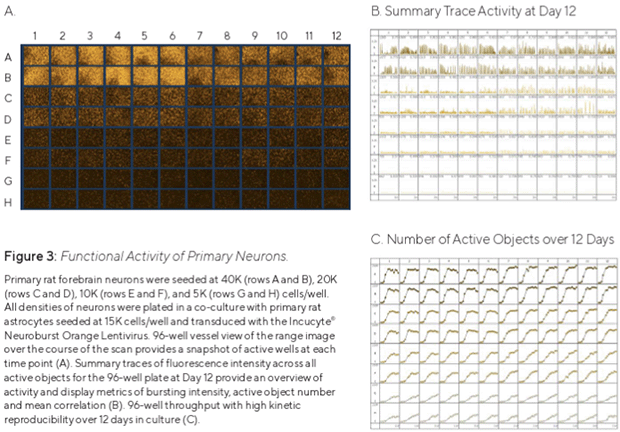
Figure 3: Functional Activity of Primary Neurons.
Primary rat forebrain neurons were seeded at 40K (rows A and B), 20K (rows C and D), 10K (rows E and F), and 5K (rows G and H) cells/well.
All densities of neurons were plated in a co-culture with primary rat astrocytes seeded at 15K cells/well and transduced
with the incuCyte Neuroburst Orange Lentivirus.
96-well vessel view of the range image over the course of the scan provides a snapshot of active wells at each time point (A).
Summary traces of fluorescence intensity across all active objects for the 96-well plate at Day 12 provide an overview of activity and
display metrics of bursting intensity, active object number and mean correlation (B).
96-well throughput with high kinetic reproducibility over 12 days in culture (C).
Functional Profiling of Different iPSC-derived Neurons
Incucyte® Live-Cell Analysis System 과 Incucyte® Neuroburst Orange Lentivirus 를 사용하여, 배양 기간 30~50일 동안 네 가지 유형의 iPSC (유도만능줄기세포) 유래 뉴런을 평가하였습니다.
실험에 사용된 세포는 iCell® GlutaNeurons (Figure 4A), iCell® GABANeurons (Figure 4B), iCell® DopaNeurons (Figure 4C, 생쥐 성상세포와 공동 배양), 그리고 CNS.4U 뉴런 (Figure 4D) 입니다.
iCell® GlutaNeurons 는 인간 iPSC에서 유래한 글루탐산성 신경세포(enriched cortical neurons) 로, 공동 배양 10일 이내에 1,500개 이상의 세포에서 칼슘 버스트 (Ca2+ burst) 활성이 빠르게 유도되었으며,
이 활동이 높은 상관관계를 나타냈습니다.
iCell® GABANeurons 는 95% 이상의 순수 GABA성 (억제성) 뉴런으로 구성된 배양 시스템으로, 공동 배양 첫 주 동안 칼슘 버스트 활성을 보이는 세포 수가 빠르게 증가했습니다.
그러나 이 뉴런들은 실험 기간 동안 유의미한 상관관계를 나타내지 않았으며, 이는 억제성 뉴런의 특성과 일치하는 결과였습니다.
배양 14일 차에 수행된 세포 활성 분석 (Figure 4A 및 4B) 에서, iCell® GlutaNeurons 와 iCell® GABANeurons 모두에서 상당한 수의 활성 세포가 관찰되었습니다.
하지만, iCell® GlutaNeurons 는 iCell® GABANeurons 보다 더 강한 칼슘 버스트 강도와 높은 동기화 (Synchronicity) 를 보였습니다.
흥미롭게도, iCell® DopaNeurons 는 iCell® GlutaNeurons 와 매우 유사한 활동성을 보였으며, 배양 첫 10일 이내에 높은 활성과 높은 상관관계를 가지는 신경망이 빠르게 형성되었습니다.
한편, Ncardia® CNS.4U 세포는 hiPSC (인간 유도만능줄기세포) 에서 유래한 뉴런과 성상세포의 공동 배양 모델을 대표합니다.
이 세포들은 배양 첫 주에 약 1,200 개의 세포에서 강한 활성을 보였으며, 배양 34일 차부터 상관관계 기반 네트워크 연결성 (network connectivity) 이 증가하기 시작했습니다.
실험 종료 시점인 45일 차에는 상관계수 0.7에 도달하였습니다.
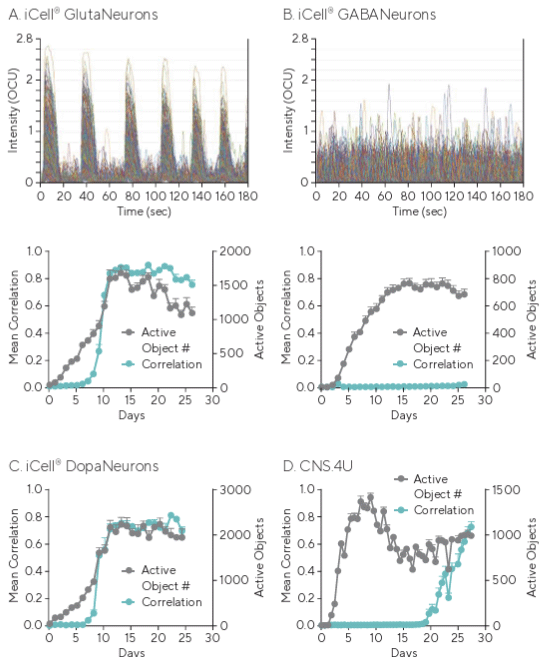
Figure 4: Functional Activity of Different iPSC-derived Neurons
iCell® GlutaNeurons, iCell® GABANeurons, iCell® DopaNeurons (Cellular Dynamics International) and CNS.4U neurons (Ncardia®) were
all seeded at 20K cells/well. iCell® GlutaNeurons, iCell® GABANeurons and iCell® DopaNeurons were also plated with a co-culture of rat astrocytes
seeded at 15K cells/well. Neurons were infected with Incucyte® Neuroburst Orange Lentivirus, and Active Object Number and
Mean Correlation were quantified for up to 45 days. Example calcium oscillation traces and kinetic graphs of activity metrics over time
for iCell® GlutaNeurons (A) and iCell® GABANeurons (B).
Mean Correlation and Active Object Count were quantified for iCell® DopaNeurons (25 days) (C) and CNS.4U neurons (45 days) (D).
Data points represent Mean ± SEM.
Insights Into Structure-Function Quantification
말초신경병증(Peripheral neuropathies)은 Paclitaxel (Taxol®) 과 같은 화학항암제의 흔한 부작용으로, 감각 기능 저하 및 마비와 관련이 있습니다.
신경독성(neurotoxic) 효과를 연구하기 위해, 생쥐 대뇌 피질 뉴런(primary rat cortical neurons) 을 생쥐 성상세포(primary rat astrocytes) 와 함께 11일 동안 공동 배양하여
배양 환경이 성숙하고 안정화되도록 하였습니다.
이후, Incucyte® Neuroblast Orange 와 Incucyte Neurolight Orange Lentivirus 를 사용하여 매일 신경 활동 및 형태학적 변화를 측정하였습니다 (Figure 5).
배양 11일 차 (Day 11) 에, 배양된 세포에 Taxol® 을 다양한 농도로 처리하였으며, 이후 추가 11일 동안 신경 활동과 형태 변화를 지속적으로 모니터링하였습니다.
Figure 5 에서 확인할 수 있듯이, 배양 21일 차 (Day 21) 에 서브-나노몰 (<10^-9M) 농도의 Taxol® 을 처리한 경우, 신경 돌기 (Neurite) 길이 변화는 미미했으나,
뉴런 활동은 감소하는 것이 관찰되었습니다 (Figure 5C).
또한, 개별 well에서 기록된 신경 활동 분석 결과 (Figure 5D) 에서는 Taxol® 처리 농도와 시간에 따라 신경 활동이 변화하는 경향이 나타났습니다.
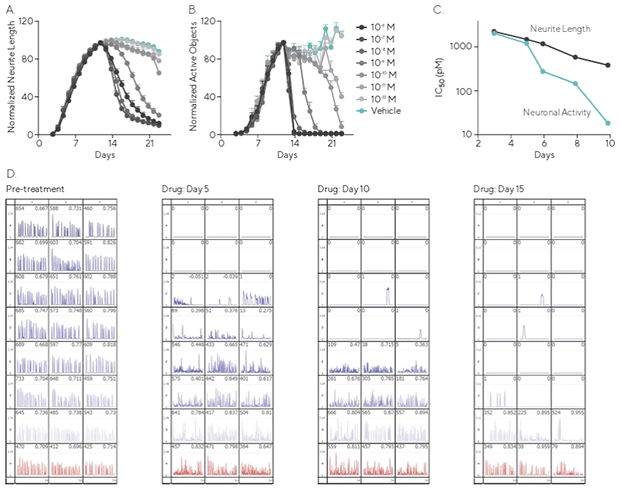
Figure 5 : Quantifying Pharmaceutical Neurotoxic Effects of Chemotherapeutic Taxol®
Rat cortical neurons seeded at 30K cells/well were co-cultured with rat astrocytes seeded at 15K cells/well and transduced with
Incucyte ® Neuroburst Orange or Neurolight Orange Lentivirus at Day 3 in culture. Live-cell analysis measurements were made each day
using the Incucyte Live-Cell Analysis System. After 11 days, neural networks had fully formed and stabilized.
Taxol ® ® or vehicle control was then added and cultures were monitored for an additional 11 days.
Time courses of neurite development (A) and neuronal activity (B) prior to, and after the addition of, control or increasing concentrations of Taxol are shown.
Potency (IC 50 values) plotted against time post-treatment for neuronal activity (grey) and neurite length (orange) (C).
Data is expressed as % neurite length or active object count, normalized to the pre-treatment value.
Data points represent Mean ± SEM. Neuronal activity summary traces at pre-treatment and at 5, 10, and
15 days post-treatment display decreased activity levels over the course of the experiment (D).
Stem Cell Development Workflow
인간 iPSC (유도만능줄기세포) 유래 뉴런과 성상세포 (glia) 를 단독 배양 (monoculture) 또는 공동 배양 (co-culture) 하는 고급 인간 세포 기반 모델이 최근 몇 년 동안 활발히 개발되고 있습니다.
이러한 모델은 인간의 종 (species) 및 질병 (disease) 과 관련성이 높은 시스템을 제공하며, Live-Cell Analysis 를 통해 이러한 임상 적용 가능성이 높은 모델 (translational model) 을
심층적으로 연구할 수 있습니다. 이를 통해 신경퇴행성 질환 (neurodegenerative diseases) 에 대한 새로운 약리학적 치료법을 발견할 기회를 제공합니다.
인간 iPSC 유래 모델을 개발할 때에는 견고한 연구 방법 (robust methods) 이 필요합니다. 여기에는 세포 특성 분석(characterization) 과 최종 모델의 품질 관리 (QC, quality control) 과정이 포함됩니다.
Figure 6 은 Talisman Therapeutics 에서 개발한 인간 iPSC 유래 뉴런의 분화 및 특성 분석 워크플로우를 보여줍니다. 이 워크플로우에서는 뉴라이트 성장 (neurite outgrowth) 과 뉴런 활동 (neuronal activity) 의
정량적 평가가 Incucyte® Live-Cell Analysis System 을 활용하여 다른 분석 기법과 함께 통합될 수 있는 과정을 설명합니다.
배양이 완료된 후, 이 뉴런들은 활성 신경망 (active networks) 을 형성하며, 이를 통해 신경퇴행성 질환 치료를 위한 새로운 후보 물질을 테스트할 수 있는 모델로 활용될 수 있습니다.
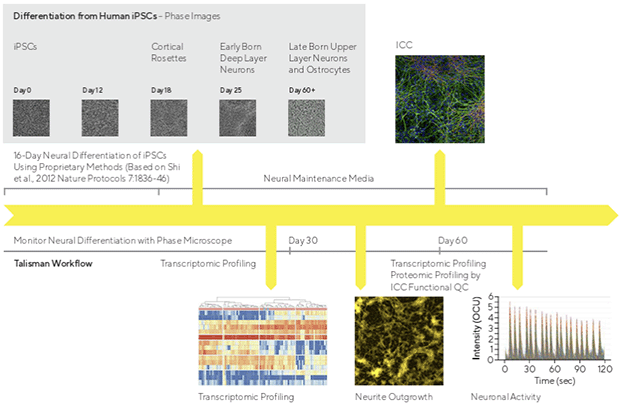
Figure 6 : Differentiation of Human iPSC-Derived Neurons Workflow
Glia Modulation
전통적으로 뇌 기능이 뉴런 활동 (neuronal activity) 만으로 이루어진다는 관점이 지배적이었지만, 최근에는 뉴런과 글리아 (glia) 가 함께 조율하는 보다 통합적인 관점이 널리 받아들여지고 있습니다.
성상세포 (Astrocytes) 는 양방향 신호 전달 (bidirectional communication) 을 통해 뇌 활동의 적극적인 파트너 역할을 하며, 이는 삼부신경접합 (tripartite synapse) 에서 조절됩니다.
삼부신경접합은 뉴런의 시냅스 전(pre-synapse) 및 시냅스 후(post-synapse) 부위와 이들을 둘러싼 성상세포(astroglia)의 밀접한 상호작용으로 구성됩니다.
뉴런에서 발생하는 칼슘 진동 (calcium oscillations) 의 변화를 통해 성상세포가 신호 전달에 미치는 영향을 연구하기 위해, Talisman Therapeutics 와 협력하여
humanized live-cell 기반의 뉴런 활동 모델을 개발하였습니다.
최근 hiPSC (인간 유도만능줄기세포) 기술의 발전은 인간 신경계의 정상 및 질병 상태를 연구하는 강력한 시험관 (in vitro) 모델 전략을 제공합니다.
뉴런의 신경돌기(outgrowth) 외에도, 뉴런 활동 측정은 Incucyte® Neurotrack Analysis Software Module을 이용한 타임랩스 이미징(time-lapse imaging) 자동 분석을 통해 수행될 수 있습니다.
이 소프트웨어를 활용하면 세포체(cell bodies)와 신경돌기(neurites)를 구별하고 동적으로 정량화(kinetically quantified)할 수 있습니다.
단독 배양 (monoculture) 으로는 관찰할 수 없는 더 복잡한 시스템에서의 뉴런-성상세포 상호작용을 공동 배양 (co-culture) 을 통해 연구할 수 있습니다.
뉴런을 성상세포와 공동 배양한 경우, 단독 배양보다 더 크고 복잡하게 가지 친 신경돌기가 형성되었습니다 (Figure 7).
또한, 공동 배양 모델은 단독 배양 모델과 기능적 프로파일 (functional profile) 에서도 차이를 보였습니다.
공동 배양된 뉴런들은
- 활성 신경 세포 (active objects, 개수/이미지) 증가
- 버스트 지속 시간 (burst duration, sec) 증가
- 버스트 빈도 (burst rate, 개수/min) 감소
- 네트워크 상관성 (network correlation) 을 유지시키는데 이러한 결과는 성상세포의 존재가 뉴런 네트워크의 안정성을 증가시킨다는 것을 의미합니다.
뉴런과 성상세포를 함께 배양했을 때, 뉴런 단독 배양과는 다른 네트워크 활동 패턴이 나타났습니다.
공동 배양된 뉴런은
- 더 길고 지속적인 칼슘 이벤트(calcium events) 발생 빈도가 감소
- 보다 성숙한 신경망 특징을 나타냄
- 연속적인 활동전위 발화(action potential firing trains) 능력 증가시킵니다.
이러한 결과는 성상세포가 뉴런의 구조적 발달뿐만 아니라 네트워크 활동과 안정성에도 중요한 역할을 한다는 것을 시사합니다.
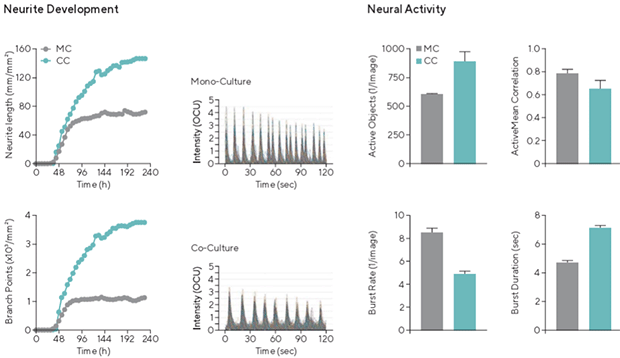
Figure 7 : iPSC Neurons Co-cultured With Astrocytes Yield Greater Outgrowth and Branching and Neuronal
Network Activity Is Modified
Network activity in neuron-astrocyte co-culture differs from monocultures, displaying a reduced frequency of
longer-lasting burst rates (characteristic of a more mature neuronal network through the development of a network’s ability
to fire trains of APs). n = 12. Traces and bar charts are 23 days post-infection.
Conclusions
이 Application Note 에서는 Incucyte® Live-Cell Analysis System을 Orange/NIR 또는 Green/Orange/NIR 광학 모듈과 함께 구성하여, 다양한 뉴런 표현형 (neuronal phenotypes) 의
특성 분석 및 성숙 과정의 최적화를 지원하는 데이터를 소개합니다.
이 단일 live-cell imaging platform 은 Incucyte® Neuroburst Orange Lentivirus와 결합하여
- 비침습적인(non-perturbing) 시약과 검증된 프로토콜을 활용하고
- 장기적으로 뉴런 집단의 형태(morphology)와 칼슘 플럭스(calcium flux) 동역학을 연속적으로 모니터링 하며
- Incucyte® Neuronal Activity Analysis Software Module을 통해 비전문가도 쉽게 활용 가능한 가이드 인터페이스를 제공합니다.
이 시스템은 생리적 조건을 유지하는 인큐베이터에서 사용 가능하며, 기본 (primary) 뉴런 및 iPSC (유도만능줄기세포) 유래 뉴런 모델 등 다양한 뉴런 세포 유형과 함께 활용할 수 있습니다.
위에서 설명한 바와 같이, 이 시스템과 시약 조합은 기존의 단일 시간점 분석 방식이 놓칠 수 있는 뉴런 네트워크 활동 및 연결성 (connectivity) 의 실시간 동적 정보를 제공합니다.
신경과학 연구에서는 다음과 같은 질문들이 오랫동안 풀리지 않은 문제였습니다.
- iPSC 유래 뉴런이 언제 기능적으로 활성화되는가?
- 뉴런의 활성을 최적화하는 방법은 무엇인가?
- 배양된 뉴런의 시냅스 연결성(synaptic connectivity)에 대한 통찰을 어떻게 얻을 것인가?
본 연구에서는 주로 GABA 및 Gluta iPSC 유래 뉴런 모델을 활용하여,
Incucyte® Live-Cell Analysis System 이 신경 과학 연구에서 유의미한 정량적 지표 (예: 신경돌기 길이 및 세포 활동) 를 기반으로 다양한 세포 모델을 연구하는 방법을 제공함을 입증하였습니다.
또한, 이러한 질병 관련 인간화(humanized) 모델을 활용하여 약리학적 조절(pharmacological modulation) 연구도 가능합니다.
마지막으로, Incucyte® Live-Cell Analysis System 의 높은 신뢰성과 처리량 (robustness & throughput) 덕분에 연구자들은 iPSC 유래 뉴런 모델 개발을 개선하기 위해 다양한 변수를 보다
효과적으로 분리하고 연구하는 데 집중할 수 있습니다.
Incucyte® Live-Cell Analysis System은 뉴런 표현형과 성숙(maturation) 과정 분석을 위한 종합적인(end-to-end) 솔루션을 제공합니다.
이는 단순히 뉴런의 기능적 연구에 국한되지 않고,
- 다양한 신경과학적 질문을 해결할 수 있는 중요한 정보를 제공하며
- 기존 방법으로는 놓칠 수 있는 데이터까지 포착할 수 있도록 지원합니다.
|
|
|
|


