| Phone |
| |
| |
| 대표전화 |
1577-7956 |
| 본 사 |
031-457-9187 |
| 대 전 |
042-932-1265 |
| |
|
| Web Site Visitors |
| |
| |
| Today |
1088 |
| Yesterday |
1502 |
| Since 2006 |
2,728,877 |
| |
|
|
|
Introduction
Monoclonal antibody (mAb, 단일클론 항체) 는 항암, 항염증, 항바이러스 치료제로 광범위하게 사용되고 있습니다.
세포안으로 들어가는 속도나 위치, 내재화 정도는 항체의 중요한 특성입니다.
예를 들어 항체-약물 접합체는 세포 독성 물질을 세포에 전달함에 세포 특이성과 흡수율은 분자의 안정성과 효능에 매우 중요한 요소입니다.
또한, 단일클론 항체는 종양 세포 제거를 위해 종양 세포를 표지하고, 종양 세포의 생존과 관련된 수용체의 내재화를 유도하는 면역 요법에서 사용되고 있습니다.
세포 표면에서 항체가 제거되는 속도는 항체의 치료적 프로파일링에 강한 영향을 미칩니다.
일반적으로 항체의 내재화는 특이적 (표적 매개) 이거나 비특이적( 예, 내피세포의 표현형적 특징) 작용에 의해 이루어지고, 이는 항체의 체내 반감기에 영향을 주는 주요 요소입니다.
또한, 단일클론 항체의 작은 구조적 수정도 활성 기간에 큰 영향을 미칠 수 있습니다.
세포에 대한 항체 내재화에 대한 이해와 여러 항체에 대한 이해는 생물학적 약물 개발에서 항체 선택과 최적화의 중요한 요구 사항입니다.
현재 항체 내재화를 직접 정량화하는 방법은 노동 집약적이고 시간이 많이 소요되며 여러 항체를 동시에 시험하기에는 적합하지 않습니다.
이러한 분석법은 각 항체에 형광 태그를 부착해야 하고, 표지가 부착된 항체와 표지가 없는 항체를 분리하기 위해 분리 과정을 거쳐야 합니다.
분석은 내재화된 항체의 신호를 세포 외부의 신호와 확실히 구분할 수 있어야 합니다.
세척 단계, 염색 차단제, 또는 세포 활동을 느리게 하기 위한 온도 저하 등이 일반적으로 사용됩니다.
거의 모든 방법 (예: 유세포 분석, 고해상도 이미징) 은 실험 종료 시점의 정보를 제공하며, 시간에 따른 내재화를 추적하려면 반복 실험이 필요합니다.
이 application note에서는 Incucyte® 실시간 세포 이미징 및 분석과 새로운 pH-민감성 염료가 결합된 항체 조각 (Incucyte® Fabfluor-pH 항체 표지 염료) 을 기반으로 한 통합 분석 솔루션을 설명합니다.
이 솔루션을 통해 항체-약물 접합체를 이용한 면역 치료제 개발을 위한 산업과 기초과학 연구에서 기존 방법들의 한계를 극복한 많은 수의 여러 항체의 항체 내재화 비교를 위한
간단하고 쉽게 사용할 수 있는 방법을 제공합니다.
Assay Principle
Incucyte® Fabfluor-pH Antibody Labeling 염료는 Fc 영역을 표적으로 하는 Fab 단편에 pH 감응형 fluorescent probe 가 결합된 제품입니다.
이러한 시약은 동종의 Fc 를 포함하는 모든 항체에 대해 일반적인 One Step, 세척이 필요 없는 라벨링 프로토콜을 제공합니다.
pH 7.0 에서 Fab-Ab 복합체는 형광을 거의 또는 전혀 나타내지 않습니다. 라벨링된 항체를 세포에 추가하면, 산성 (pH 4.5?5.5) lysome 및 endosome 을 통해 형광 신호가 처리됩니다 (Figure 1).
Internalization 의 전체 시간 경과는 Incucyte® 실시간 라이브 셀 분석을 사용하여 시각화되고 자동으로 정량화됩니다.
이 라벨링 방법과 분석 워크플로는 소형화된 96/384 well plate 형식에서 다수 (10~100개 이상) 의 항체 내부화 속도를 비교하는 데 적합합니다.
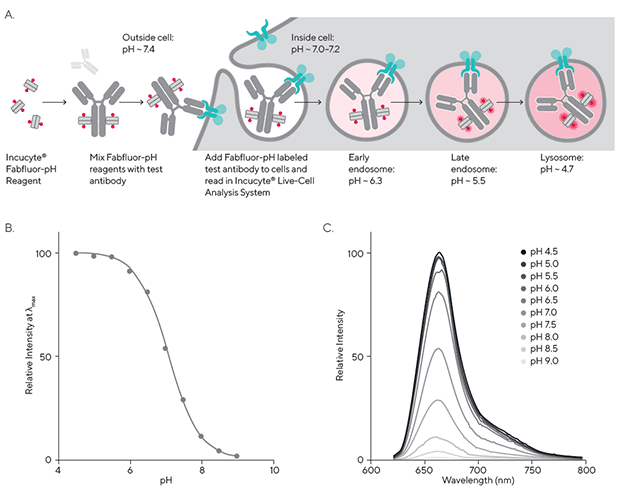
Figure 1: Principle of antibody Internalization assay using Incucyte® Fabfluor-pH labeling dye (A). Fluorogenic signal as internalized antibody is
processed into the acidic endosome and lysosome. Data to show the pH sensitivity of the labeling probe (B and C). Note the relatively low fluorescence of Fabfluor-pH at pH 7.0.
Quick Guide
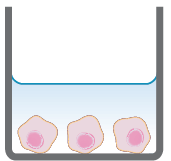 |
[1] Seed cells
Seed cells (50 μL/well, 5,000 - 30,000 cells/well), into 96-well plate and leave to adhere (2 - 24 h, depending on cell type). |
|
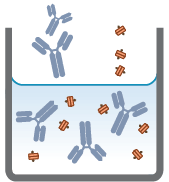 |
[2] Mix antibody and Incucyte® Fabfluor-pH Dye at a molar ratio of 1:3 in media, 2x final assay concentration. Incubate for 15 minutes at 37 °C to allow conjugation. |
|
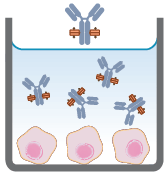 |
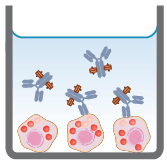
[3] Add Fabfluor-antibody mix (50 μL/well) to cell plate. |
|
 |
[4] Capture images every 15 - 30 minutes (10x or 20x) in Incucyte® Live-Cell Analysis System with appropriate fluorescent module configured for 24-48 hours.
Analyze using integrated software. |
|
Validation Data
[1] Proof of Concept
HT-1080 (Fibrosarcoma Cells) 의 CD71 Transferrin Receptor 를 통해 항체 내재화 검증을 수행하였습니다.
anti-CD71 항체와 Mouse IgG1 isotype 대조군은 isotype 에 맞는 Incucyte® Fabfluor-pH Red Mouse IgG1 Antibody Labelng dye 로 표지되었습니다.
Fabfluor-pH 로 표지된 항체 (4 μg/mL) 는 세포에 추가되었고, Incucyte® Live-Cell Analysis System 에서 12시간 동안 (위상 차, 적색 형광) 모니터링하였습니다.
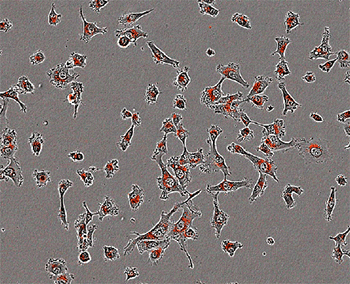
A. Fabfluor-pH-α-CD71 이 처리된 세포는 세포질에서 붉은 형광이 관측되었습니다.
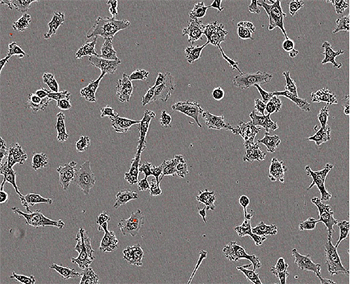
B. Isotype을 처리 한 세포에서는 어떠한 형광 신호도 관측할 수 없었습니다.
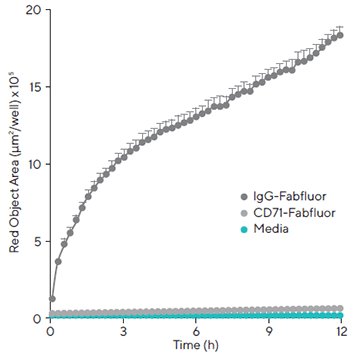
C. 표지된 α-CD71을 처리한 세포에서 붉은 영역이 시간이 지남에 따라 증가하는 것을 확인할 수 있었습니다.
 |
[A] CD-71-Fabfluor-pH |
|
 |
[B] IgG-Fabfluor-pH |
|
 |
[C] |
|
Figure 2: Internalization of Incucyte® Fabfluor-pH labeled α-CD71 in HT-1080 cells. HT-1080 cells were treated with either Incucyte®
Fabfluor-pH labeled α-CD71 or IgG1 isotype control (4 μg/mL), HD phase and red fluorescence images (10X) were captured every 15 min over 12 h.
Images of cells treated with Fabfluor-pH-α-CD71 display red, cytosolic fluorescence (A). Cells treated with labeled isotype control display no cellular fluorescence (B).
Time course data shows a rapid increase in red object area over time in cells treated with labeled α-CD71 but not with isotype control (C).
Images shown taken at 6 h post treatment, data shown as mean of 3 wells ± SEM.
[2] Normalization for Cell Number
이론적으로 항체 내재화의 신호는 세포 수에 따라 증가합니다. 이를 검증하고 세포 증식이 시간이 지남에 따라 신호에 미치는 영향을 알아보기 위해,
다양한 세포 수 (1~2*103 cells/well) 로 배양하여 실험을 수행하였습니다.
Anti-CD71의 내재화 (붉은 형광) 는 1*10³ cells/well에서도 확인되었고, 배양된 세포 수가 높을수록 현저하게 증가한 것을 확인할 수 있습니다.
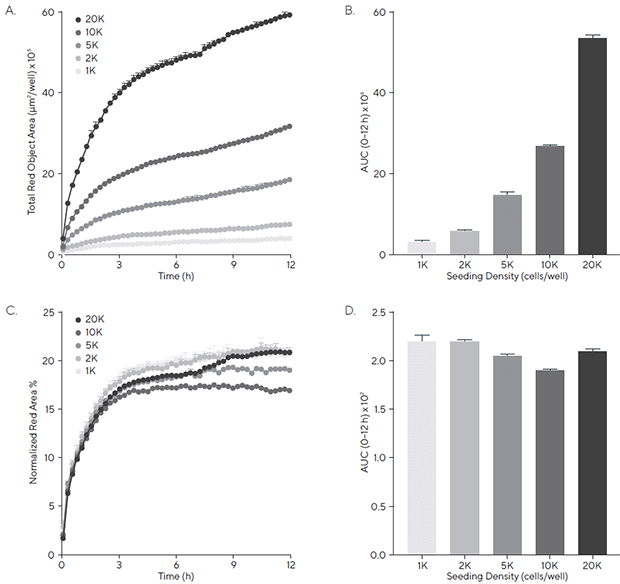
Figure 3: Antibody internalization response is cell number dependent. An increasing density of HT-1080 cells were seeded (1?20 K/well) and treated
with Incucyte® Fabfluor-pH labeled α-CD71 (4 μg/mL). HD phase and red fluorescence images (10X) were captured every 30 min over 12 h.
The timecourse of red object area data demonstrates an increasing internalization signal with increasing cell number (A and B).
When the red object signal is normalized for phase area, it is clear the internalization response size is dependent on cell number (C and D).
All data shown as a mean of 3 wells ±SEM, bar graphs show area under the curve (AUC) calculated from time course data.
[3] Signal Co-Localization With Lysosomal Marker
내부화된 항체가 lysosome에 존재하는지 확인하기 위해, 우리는 end-point lysosome 마커인 LysoSensor® Green (Thermo Scientific)을 이용하여 이중 표지 실험을 수행하였습니다.
Fabfluor-pH로 표지된 CD71을 HT-1080 세포에 3시간 동안 처리한 뒤, 항체 내부화를 모니터링했습니다.
A : LysoSensor® Green 으로 염색된 lysosome 이미지
B : Fabfluor-pH 표지 된 α-CD71 의 항체 내재화 이미지
C : A 와 B 의 이미지를 merge 한 이미지
D : 세포내로 들어간 항체의 위치와 lysosome 의 위치가 동일한 것을 확인할 수 있습니다 (동일 위치를 노란색으로 표시).
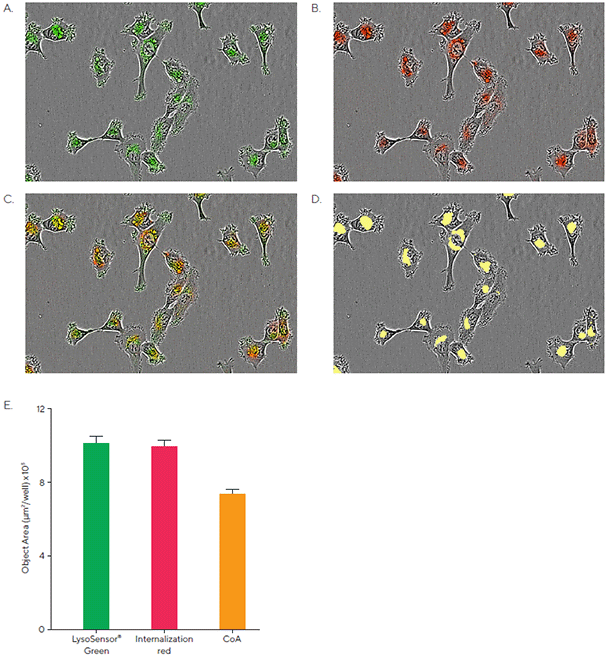
Figure 4 : Co-localization of Incucyte® Fabfluor-pH labeled α-CD71 and LysoSensor® Green in HT-1080 cells. Internalization of Incucyte® Fabfluor-pH labeled α-CD71 (4 μg/mL)
was established for 3 h in HT-1080 cells before addition of LysoSensor® Green DND-189 (Thermo, 0.25 μM).
Images show individual LysoSensor® Green and Fabfluor-pH labeled α-CD71 red signal (A and B), co-localization of red and green signals (C),
and the co-localized analysis mask shown in yellow (D). (E)
Incucyte® analysis of the coincidence of the red and green fluorescence confirms co-localization of 74% of the red signal with the green signal.
Images captured at 20X magnification, 30 min post LysoSensor® addition, data shown as mean of 4 wells ± SEM
[4] Applicability Across Different Cell Types and Antibodies
이 실험법의 광범위한 적용성과 특이성을 입증하기 위해, 다양한 세포주에서 발현되는 특정 CD 마커를 표적으로 여러 항체에 대해 항체 내재화를 평가하였습니다.
A, B: CD71, CD3, Cd20, CD45 에 대한 시간대별 항체 내재화 정도를 확인한 결과, 시간이 증가함에 따라 항체 내재화의 수준이 증가한 것을 확인할 수 있었습니다.
C: B 세포에 특이적인 CD20 은 Raji 세포에서 항체 내재화가 발생한 것을 확인할 수 있었고, T 세포에 특이적인 CD3 는 Jurkat 세포에서에서 항체 내재화가 발생한 것을 확인할 수 있었습니다.
일반적인 림프구의 마커인 CD71 과 CD45 는 두 세포 모두에서 항체 내재화가 발생한 것을 확인할 수 있었습니다.
이 결과는 세포들의 알려진 CD 표면 마커 발현과 일치하며, 신호의 특이성과 방법의 일반적인 유용성에 대한 강한 신뢰를 뒷받침할 수 있습니다.
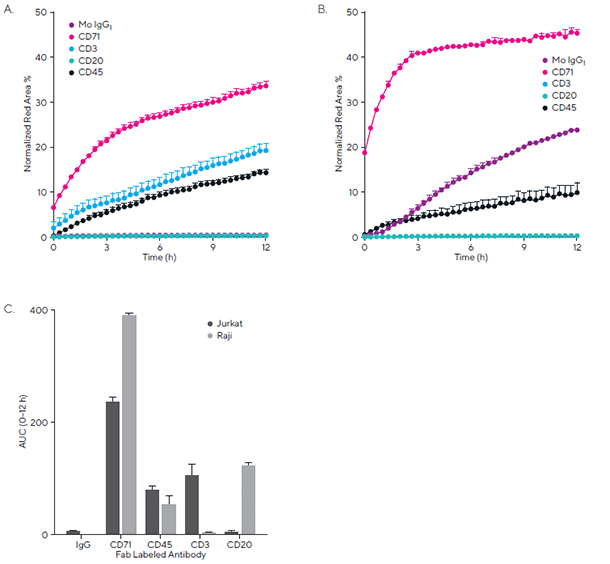
Figure 5: Internalization of CD surface marker targeted antibodies in lymphocytic cell lines. Jurkat (T cell-like) and Raji (B cell-like) cells (30 K/well) were treated with
different Incucyte® Fabfluor-pH labeled antibodies (4 μg/mL).
HD phase and red images were captured every 30 min using a 20X objective over 12 h. Time course data (A and B) and area under the curve (AUC, C) analysis demonstrates
the response profile in both cell lines. All data shown as a mean of at least 4 wells ± SEM, time course data shown as normalized red area.
Quantitative Pharmacological Analysis
[1] Pharmacological, Kinetic Quantification of Antibody Internalization
이 실험법의 정량적인 특성과 치료용 항체 분석에 적합함을 설명하기 위해, 임상에서 사용되는 단일클론 항체인 Herceptin(Trastzumab)과 Rituxan(Rituximab)의 세포 내 흡수에 대한 EC50 값을 측정하고자 했습니다.
Figure 6, A: BT-474 Her2 positive 세포에서 Fabfluor-pH로 표지된 Herceptin이 농도 의존적으로 증가하는 것을 확인할 수 있었습니다.
Figure 6, B: Area under the curve(AUC) 분석을 통해 농도 의존적인 반응을 확인할 수 있었고, EC50 값은 323 ng/mL로 측정되었습니다.
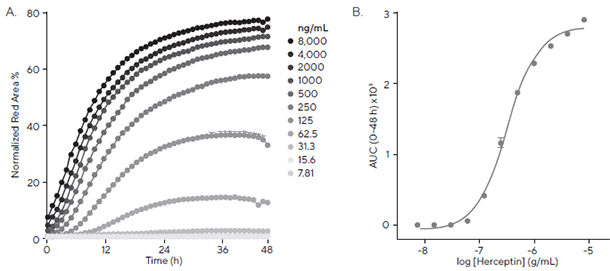
Figure 6: Quantitative pharmacological analysis of Incucyte® Fabfluor-pH labeled Herceptin. BT-474 Her2-positive cells were treated with increasing
concentrations of Fabfluor-pH labeled Herceptin. The time course graph displays an increase normalized red area over time with increasing Herceptin
concentrations (A). Area under the curve analysis of this response displays a clear concentration dependent response with an EC50 of 323 ng/mL (B).
All data shown as a mean of 3 wells ± SEM, time course data shown as normalized red area.
Figure 7, A: Raji 세포에서 Fabfluor-pH로 표지된 Herceptin이 농도 의존적으로 증가하는 것을 확인할 수 있었습니다.
Figure 7, B: Area under the curve(AUC) 분석을 통해 농도 의존적인 반응을 확인할 수 있었고, EC50 값은 426 ng/mL로 측정되었습니다
.
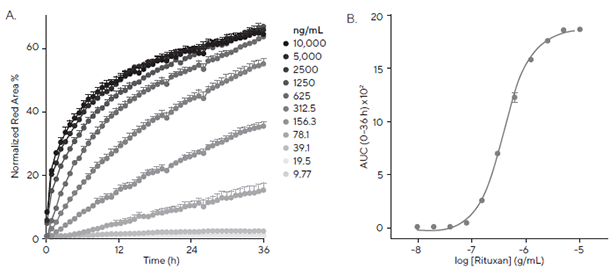
Figure 7: Quantitative pharmacological analysis of Incucyte® Fabfluor-pH labeled Rituxan. Raji cells were treated with increasing concentrations of
Fabfluor-pH labeled Rituxan. The time course graph displays an increase normalized red area over time with increasing Rituxan concentrations (A).
Area under the curve analysis of this response displays a clear concentration dependent response with an EC50 of 426 ng/mL (B). All data shown as
a mean of 3 wells SEM, time course data shown as normalized red area.
[2] Comparison of Multiple Test Antibodies for High-Throughput Screening
Incucyte® Antibody Internalization Assay 의 특징은 여러 항체를 병렬로 표지하고 항체의 세포 내재화를 비교하는 것이 용이하다는 점입니다.
이를 검증하기 위해, 우리는 상업적으로 이용 가능한 6개의 anti-CD71 항체를 선택하여 해당 항체의 HT-1080 세포 내재화를 비교했습니다.
6개의 항체 중 3개 (Ab 1a, Ab 2, Ab 1b) 는 항체 내재화 수준이 높았으며 낮은 농도 (<0.05 μg/mL) 에서도 내재화가 발생한 것을 확인할 수 있었습니다.
Abs 3, 4, 5 는 세포 내 흡수가 상대적으로 약하게 일어나며, 더 높은 농도에서만 흡수되었습니다 (Figure 8).
A : Incucyte로 촬영한 결과 11번과 12번 열에서 positive 및 negative 대조군 반응을 확인할 수 있었고, 두 개의 plate에 걸쳐 각 항체에 대해 농도 의존적인 반응을 확인할 수 있었습니다.
B : 각 항체들에 대한 직접 비교 분석 결과 항체들 간에 다양한 반응 범위를 확인할 수 있었습니다.
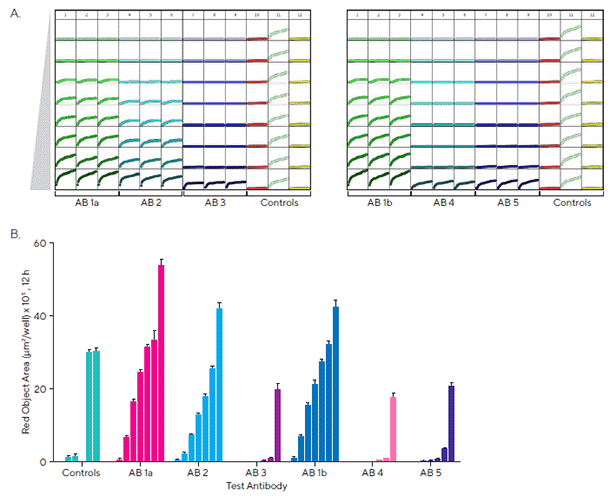
Figure 8: Screening test Abs for internalization. Six different CD71 antibodies including one clone from 2 different suppliers (clone 1a & 1b) were tested head-to-head in HT-1080 cells.
The antibodies were labeled with Incucyte® Fabfluor-pH Dye prior to addition to cells and the internalization signal captured every 30 min over 12 h using a 10X magnification.
Plate views taken from Incucyte® show clear positive and negative control responses in column 11 and 12 with concentration dependent responses for each antibody across two plates (A).
Head-to-head analysis of antibody data shows a range of responses across these clones (B) control responses at 12 h display a clear positive response.
All data shown as mean of 3 wells ± SEM, controls shown as mean of 8 wells
Conclusions
① Fc를 표적으로 하는 Fab과 결합된 pH-sensitive 염료(Incucyte® Fabfluor-pH)를 사용하여 항체를 표지하는 방법은 정제된 항체와 항체 배양액 모두 사용할 수 있습니다.
② 여러 96 well microplate에서 동시에 세포 내 흡수를 모니터링할 수 있는 Incucyte® 실시간 세포 이미지 및 분석 방법은 adherent cell과 non-adherent cell 모두 사용할 수 있습니다.
③ Incucyte는 생물학적 과정의 전체 시간을 추적 관찰하며, 높은 특이성, 민감도 및 형태학적 정보를 제공하여 세포 내 흡수를 보고하는 분석 시스템을 가지고 있습니다.
pH-sensitivie 염료를 사용하여 backgourd 신호를 최소화하고, 형광을 분리할 필요 없이 흡수 신호를 명확하게 감지할 수 있습니다.
Incucye는 이러한 특성을 토대로 항체의 세포 내재화를 직접 연구할 수 있는 간단하고 정량적 솔루션을 제공합니다.
Incucyte는 수십에서 수백 개의 항체를 병행하여 비교할 수 있습니다.
또한, 생물학적 제제 개발 초기 단계에서 항체의 세포 내재화 측정을 관찰할 수 있게 해주며, 치료 항체의 효능, 안전성, 약리학적 최적화에 유용한 tool로 활용될 수 있을 것입니다.
|
|
|
|