| Phone |
| |
| |
| 대표전화 |
1577-7956 |
| 본 사 |
031-457-9187 |
| 대 전 |
042-932-1265 |
| |
|
| Web Site Visitors |
| |
| |
| Today |
574 |
| Yesterday |
1364 |
| Since 2006 |
2,413,695 |
| |
|
 |
|
| 영진코퍼레이션 종합카다로그 |
|
|
Nicola Bevan,1 Gillian Lovell,1 Jasmine Trigg,1 Clare Szybut,1 John Rauch,2 Libby Oupicka,2 Kalpana Barnes1
1 Sartorius UK Ltd., Units 2 & 3 The Quadrant, Royston Hertfordshire SG8 5HL UK
2 Sartorius Corporation, 300 West Morgan Road, Ann Arbor, MI 48108 USA |
Introduction
Cell proliferation assays 은 암 치료, 발달 생물학 및 약물 안전성 연구의 시작입니다.
종양 연구의 기초인 sustained signaling pathways 분석은 PubMed 에 12,000개 이상의 원고가 기재되어 있으며,
그 중 대다수는 종양 세포 성장을 평가하기 위해 cell proliferation analysis 을 합니다.
단순한 실험으로 보이는 이 분석법은 몇 가지 한계가 있습니다.
그것은 바로 세포 성장에는 시간이 걸리므로 일정 시간 별로 모니터링을 해야 고품질의 결과를 얻을 수 있고,
또한 non-perturbing measurements 가 선행되어야 한다는 것입니다.
이러한 Live-cell analysis은 IncuCyte 로만 구현 가능합니다. 세포 성장을 방해하지 않으면서 재현 가능한 데이터를 도출합니다.
며칠, 몇 주 또는 몇 달에 걸쳐 time-lapse imaging, integrated image analysis, on-the-fly data visualization 을 측정함으로써
살아있는 세포의 행동을 실시간으로 정량화할 수 있습니다. 따라서 연구자가 시간별로 샘플링하는 end points assays 를 하지 않으므로
각 분석 사이에 발생할 수 있는 key biological event 를 놓치지 않고 모두 확인할 수 있습니다.
그러므로 flow cytometry 와 multimode microplate readers 를 보완할 수도 있습니다. 더 복잡한 분석을 수행하려면
label-free & specialized labeling approaches 을 같이 적용할 수 있습니다
Incucyte® Live-Cell Analysis System을 사용하면 proliferation kinetic measurement 을 다각도로 접근할 수 있습니다.
다양한 cell models 에 label-free & fluorescent assays 을 적용할 수 있습니다.
배양기 내부에 고정된 플레이트를 Incucyte® 가 촬영하기 때문에 adherent & non-adherent cells 모두에 대한 Continuous live-cell assays 이 가능합니다.
해당 글에서는 아래 주제를 소개하고자 합니다.
1. cell proliferation & cell counting 에 대한 Kinetic, label-free analysis
2. non-adherent cells 에 대한 Continuous live-cell proliferation
3. proliferation 을 추적하기 위한 Fluorescence labeling
4. High Throughput Compound Testing
Cell Proliferation & Cell Counting 에 대한 Kinetic, Label-free Analysis
A. Kinetic, Label-Free Analysis of Cell Proliferation
label-free 상태의 (A) A549 cell, (B) SKBr3 cell, (C) MDA-MB-231 cell 을 Incucyte® Live-Cell Analysis System 의 Base Analysis Software 로 촬영했습니다.
노란색으로 표시한 confluence mask 는 촬영된 이미지 내에서 각 cell 이 차지하는 면적을 의미합니다.
(D) 그래프는 MDA-MB-231 cell 의 베양 시작 농도별 proliferation 을 시간에 따른 confluence mask 으로 나타내어 정량화 한 것입니다.
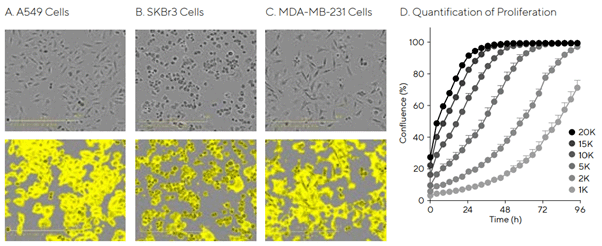
Note. A549 (A), SKBr3 (B), or MDA-MB-231 (C) cells were seeded in a 96-well plate, and images were collected
and analyzed using the Incucyte® Live-Cell Analysis System with Base Analysis Software. Shown are the original images (top row) and
the generated confluence mask in yellow (bottom row).
The graph (D) shows quantification of various starting densities of MDA-MB-231 cells proliferating over time. Data shown as mean ± SEM for 4 wells
B. Kinetic, Label-Free Cell Counting
label free 상태의 (A) A549 cell, (C) SKOV3 cell 을 Incucyte® Live-Cell Analysis System 의 Cell-by-Cell Analysis 소프트웨어를 사용하여 분석했습니다.
소프트웨어가 자동으로 cell 의 형태를 파악하여 노란색으로 segmentation mask 를 표시하여 cell count 를 수행합니다.
(B), (D) 그래프는 이러한 cell count 를 통해 측정한 cell count per image 를 나타냅니다.
두 그래프 모두 각각의 실험군에 대하여 (1) Vehicle 단독 배양, (2) cytotoxic reagent camptothecin (10 μM) 처리 배양, (3) cytostatic reagent cycloheximide
(1 μM) 처리 배양의 결과를 보여줍니다. cell count 를 실시간으로 측정하여 매우 정확하고 유의한 데이터를 도출합니다
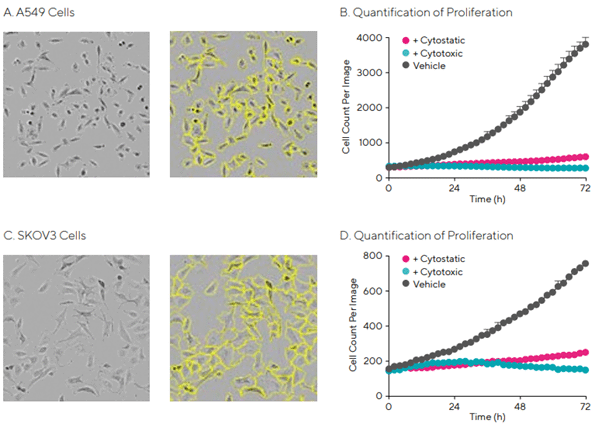
Note. A549 (A) or SKOV3 (C) cells were seeded in a 96-well plate, and images collected and analyzed
using the Incucyte® Live-Cell Analysis System with Cell-by-Cell Analysis. Shown are the original images (left column) and the generated segmentation mask in yellow (right column).
The graphs (B and D) show quantification of proliferation in the presence of vehicle, a cytotoxic reagent camptothecin (10 μM), or a cytostatic reagent cycloheximide (1 μM) over time.
Data shown as mean ± SEM for 4 wells
Non-adherent Cells 에 대한 Continuous Live-cell Proliferation
T Cell Proliferation Is Seeding Density-Dependent
(A) T cells 은 basal conditions 에서는 Proliferation이 매우 낮습니다. 그러나 활성화 (e.g., by IL-2, anti-CD3, anti-CD28) 될 경우 매우 높은 proliferation 을 보입니다.
(B) 이러한 T cells 의 proliferation 을 confluence 측정을 통해 시간에 따른 그 변화를 정량화 했습니다.
플레이트의 각 well 별로 activation regimes 의 종류와 배양 시간에 따른 proliferation 을 확인할 수 있습니다.
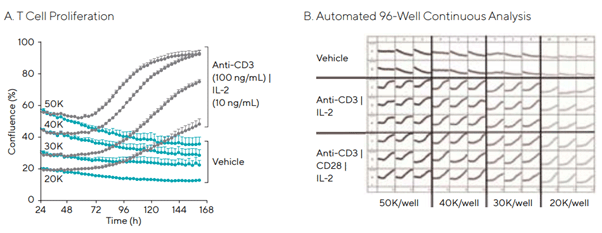
Note. T cells demonstrate little or no proliferation under basal conditions but proliferate (A)
when activated (e.g., by IL-2, anti-CD3, anti-CD28). Plate graph of change in confluence time-course reveals seeding density-dependent differences
under various activation regimes (B).
Proliferation 을 추적하기 위한 Fluorescence Labeling
HT-1080 Nuclight Cell Tri-Culture
(A, B) HT-1080 fibrosarcoma cells 을 Incucyte® Nuclight Green, Orange, NIR Lentivirus 로 처리하여 72시간 동안 연속 촬영을 했습니다.
아래 사진은 48시간에 촬영한 사진이며 Incucyte® Nuclight Green, Orange, NIR Lentivirus 로 처리한 cell 과 label-free cell 에 대하여
Incucyte® Cell-by-Cell Analysis 소프트웨어의 masking 기법을 사용했습니다.
(C, D) 그 결과 labeling color 에 따라 자동으로 cell 이 분류 및 정량화 되었고 green-, orange-, NIR-expressing cells 에 대하여 분포도 (%) 를 그래프로 나타낼 수 있습니다.
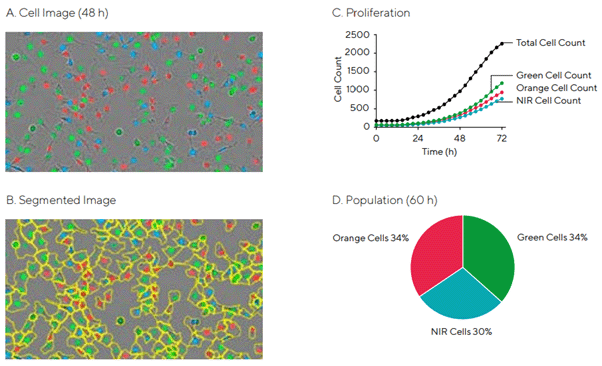
Note. HT-1080 fibrosarcoma cells stably expressing Incucyte® Nuclight Green, Orange, or NIR Lentivirus were monitored for 72 hours.
Representative images taken at 48 hours, with and without the label-free Incucyte® Cell-by-Cell Analysis mask (A, B), automatically identify the entire population of cells and
quantify percentages of green-, orange-, or NIR-expressing cells (C, D).
High Throughput Compound Testing
384-Well Microplate View of Incucyte® Nuclight Green HT-1080 Cell Proliferation With 16 Different Compounds
High throughput compound testing 은 drug discovery pipeline 공정에서 promising compounds 를 선별하는 테스트입니다.
이 또한 Incucyte® Live-Cell Analysis System 로 수행할 수 있습니다. 아래 그래프는 다양한 Drug 에 대하여 11가지 농도로 Incucyte® Nuclight Green HT-1080 Cell 에 적용 후
Proliferation 을 측정한 결과입니다. 좌측이 고농도, 우측으로 갈수록 저농도이며 각기 다른 색으로 표시했습니다.
Columns 15 는 vehicle (0.5% DMSO) 이며, Columns 16 은 CHX (3 μM) controls 입니다.
그래프를 보면 특정 약물에 대하여 (예. Row J, Row M, Row O) 매우 강하게 concentration-dependent inhibition 가 나타나는 것을 알 수 있습니다.
이와 반대로 특정 약물 (예. Row A, Row P) 에 대하여는 약한 상관관계를 보입니다.
그래프는 배양 72시간 동안의 측정 결과이며 해당 플레이트의 모든 well 에 대하여 측정했을 때 형광 개체 수는 최대 3800개까지 측정되었습니다.
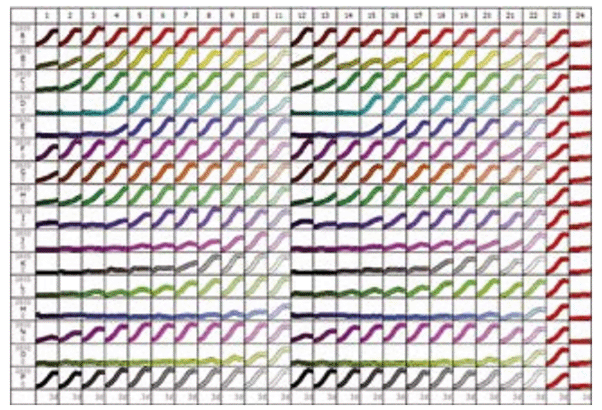
Note. 11-point concentration-response curves in duplicate (different colors, high to low concentrations left to right).
Columns 15 and 16 are vehicle (0.5% DMSO) and CHX (3 μM) controls, respectively. Note the potent concentration-dependent inhibition of cell proliferation
for certain compounds (e.g., Row J, Row M, Row O), and weaker effects | inactivity of others (e.g., Row A, Row P). Abscissa: Time (0?72 hours), ordinate:
Fluorescent Object Count per well (0--3800).
|
|
|
|


