| Phone |
| |
| |
| 대표전화 |
1577-7956 |
| 본 사 |
031-457-9187 |
| 대 전 |
042-932-1265 |
| |
|
| Web Site Visitors |
| |
| |
| Today |
1088 |
| Yesterday |
1502 |
| Since 2006 |
2,728,877 |
| |
|
|
|
Nicola Bevan, Kirsty McBain, Daryl Cole Tim Dale
Sartorius UK Ltd., Units 2 & 3 The Quadrant, Newark Close, Royston Hertfordshire SG8 5HL UK |
Introduction
항체 치료제 개발로 여러 질병에 대한 새로운 치료법이 발견되었습니다. 암 치료 분야에서는 ADC(Antibody Drug Conjugate) 복합체의 개발이 특히 유망합니다.
ADC는 monoclonal antibodies (mAbs) 을 사용하여 특징적인 마커 또는 항원을 발현하는 종양 세포에 세포독성 약물을 직접 전달합니다.
유방암, 백혈병, 다발성 골수종 및 림프종 암을 치료하는 데 사용되는 수많은 임상 관련 ADC가 현재 연구되고 있습니다.
본문에서는 유방암에 사용되는 Kadcyla® 를 논하고자 합니다. Kadcyla® 는 Human Epidermal Growth Factor Receptor 2 (HER2) 를 표적으로 하는 항체인
Trastuzumab(Herceptin®)과 세포독성제인 emtansine (DM1)의 결합체입니다.
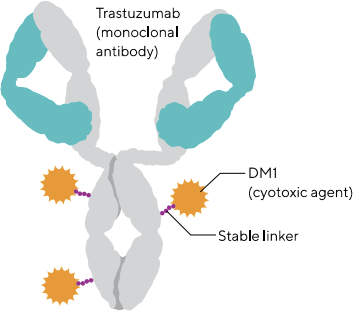
Figure 1. Kadcyla® Molecule
따라서 Kadcyla® 의 binding affinity, internalization 및 cytotoxicity 연구를 통해 약리학적 효과 (pharmacological effects) 를
분석하여 임상 치료제로서의 효능을 특성화하는 것이 중요합니다.
본문에서는 다중 기능 평가와 함께 Incucyte® Live-Cell Analysis System 을 사용하여 Kadcyla®의 다양한 생물학적 활성을
특성화할 수 있는 방법을 예시합니다.
Experiment
① HER2 positive monocultures 에서 Kadcyla® 특성 분석: antibody internalization 의 약리학적 (pharmacological),
동역학 정량화 (kinetic quantification), 세포 건강 및 세포 주기에 대한 영향을 확인하였습니다.
② antibody-dependent cell-mediated cytotoxicity (ADCC) co-culture model 에서 Kadcyla®의 효과를 확인하였습니다.
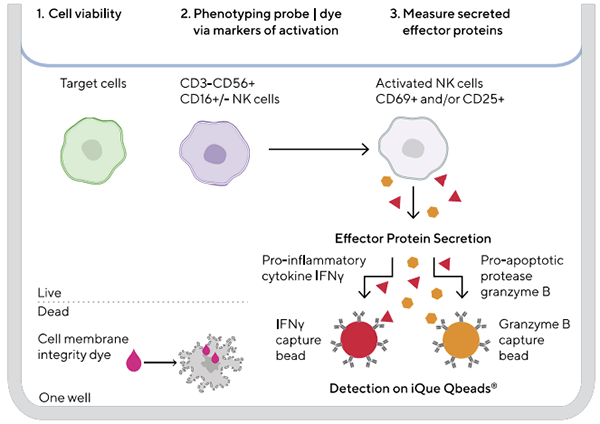
Figure 2. iQue Human NK Cell Killing Kit
Results
1. Internalization Profiles
|
A. |
Incucyte® Fabfluor-pH Orange 를 처리한 AU565 cells 에 Kadcyla®, trastuzumab, isotype IgG 를 처리했습니다. 배양 12시간 후 형광 발현 이미지를 보면 Kadcyla®, trastuzumab 에서 잘 나타남을 알 수 있습니다. |
|
|
B. |
Kadcyla® 처리 농도에 따른 Orange Area/Phase Area (%) 를 측정했습니다. 6시간이 지나자 최대 농도를 적용시킨 실험구에서 internalization signal 이 최대치에 도달했음을 알 수 있습니다. |
|
|
C. |
Kadcyla®, trastuzumab 를 처리한 실험구의 Orange Area/Phase Area 는 배양 24시간 동안 유사한 경향을 보입니다 |
|
|
D. |
HER2 low MDA-MB-231 cells 에 Kadcyla®, trastuzumab 처리했을 때 배양 24시간 뒤 Orange Area/Phase Area 를 측정했습니다. Kadcyla®, trastuzumab 는 HER2 low MDA-MB-231 cells 에 대하여 매우 낮은 internalization signal 을 보입니다. |
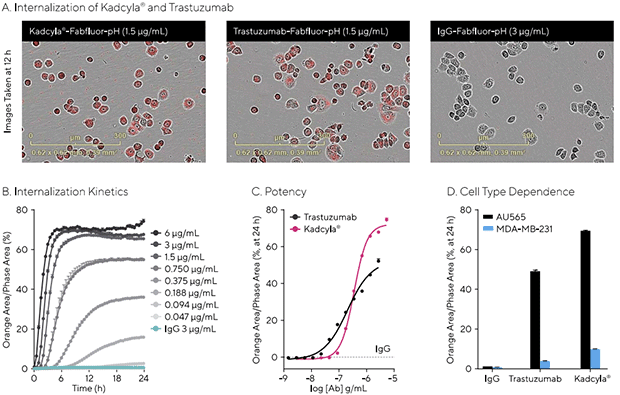
Figure 3. Internalization of Profiles
Note : AU565 cells were treated with either Kadcyla®, trastuzumab or isotype IgG complexed to Incucyte® Fabfluor-pH Orange.
Images (A) show a fluorescent signal in cells treated with either Kadcyla® or trastuzumab but not IgG.
The time course (B) shows a rapid concentration related internalization signal for Kadcyla®, which has a similar potency to trastuzumab (C).
No internalization is seen with the isotype control (teal [B], dotted line [C]). The bar graph (D) demonstrates the specificity of the signal with no signal measured in HER2 low MDA-MB-231 cells.
All data shown as the mean ± SEM for 3 wells.
2. Effects of Proliferation
|
A. |
Nuclight Green-expressing AU565 cells 을 Kadcyla®, trastuzumab, isotype IgG, camptothecin (CPT) 으로 처리했습니다. 배양 72시간 후 형광 발현 이미지를 보면 Kadcyla® 을 처리한 실헐구에서 매우 낮은 viability 를 확인할 수 있습니다 |
|
|
B. |
Kadcyla® 실험구에서 시간에 따른 Green Nuclear Count/Well (x 104) 를 측정했습니다. 시간이 갈수록 세포수가 감소합니다 |
|
|
C. |
반면에 trastuzumab 실험구에서는 감소 경향이 보이지 않습니다. isotype control (청색) 또한 감소 경향이 없습니다. 그러나 CPT (흑색) 은 가장 많은 세포 사멸을 보입니다. |
|
|
D. |
배양 72시간 후에 측정한 처리 농도 별 Potency of effect of Kadcyla® 는 0.24 μg/mL 입니다. |
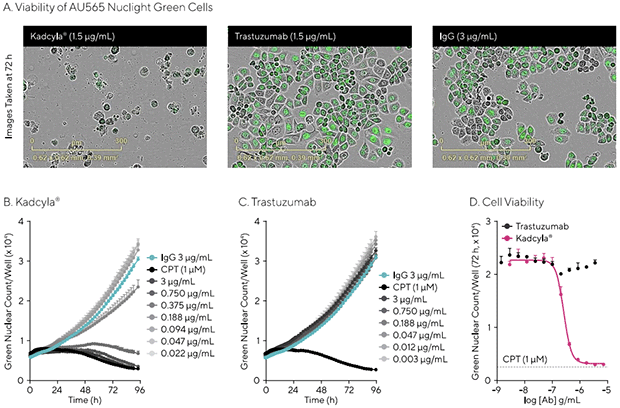
Figure 4. Effects on Proliferation
Note : Nuclight Green-expressing AU565 cells were treated with either Kadcyla®, trastuzumab, isotype IgG or camptothecin (CPT).
Images (A) show the poor health of cells treated with Kadcyla® and lack of effect of trastuzumab or IgG.
The time course (B) shows a rapid concentration related decrease in cell numbers after Kadcyla® treatment while trastuzumab (C) has no effect.
The isotype control (teal line) has no effect on cell proliferation while CPT (black line) causes maximal cell death.
Potency of effect of Kadcyla® (D) is quantified after 72 h.
All data shown as the mean ± SEM for 3 wells.
3. Effect of Kadcyla® on Cell Cycle
|
A. |
Incucyte® Cell Cycle indicator 를 발현하는 AU565 cells 을 Kadcyla®, isotype IgG 로 처리했습니다. Kadcyla® 로 처리 후 시간에 따른 급격한 세포 주기의 감소를 보여줍니다. |
|
|
B. |
반면에 IgG (3 μg/mL) 실험구는 배양 24시간이 지나도 세포 주기에 변화가 없습니다 |
|
|
C. |
시간에 따른 Kadcyla® Populations (%) 입니다. |
|
|
D. |
시간에 따른 IgG Populations (%) 입니다 |
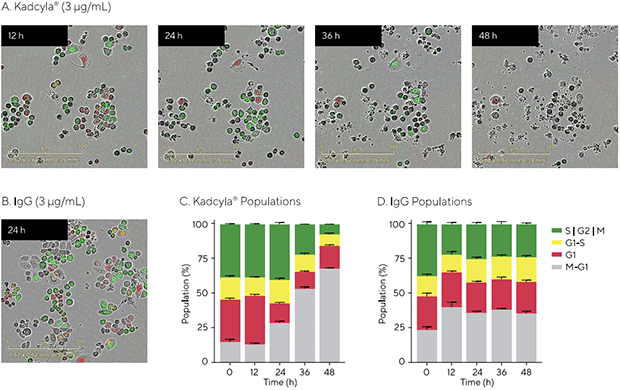
Figure 5. Effect of Kadcyla on Cell Cycle
Note : AU565 cells expressing the Incucyte® Cell Cycle indicator were treated with Kadcyla® or isotype IgG.
Series of images (A) depicting the changes in cell cycle phases after treatment with Kadcyla® or IgG (3 μg/mL, B).
The time course graphs (C and D) display the change in populations post-treatment.
All data shown as the mean ± SEM for at least 3 wells..
4. Enhanced effect of Kadcyla® with ADCC
|
A. |
Nuclight Green-expressing AU565 cells 을 monoculture 및 co-culture (with NK cells in a 1:5 target:effector cell ratio) 를 했습니다.
Incucyte® Annexin V NIR Dye 로 염색 후 Kadcyla 와 isotype IgG 로 처리했습니다. 배양 72시간 동안 monoculture 및 co-culture 에서
모두 Annexin V signal (blue) 이 증가하고 이와 반비례하여 green target cells 이 감소하는 것을 확인할 수 있습니다. NK cells (ADCC) 이
추가된 실험구의 경우 이러한 경향이 더 두드러집니다. |
|
|
B. |
이러한 NK cells 에 대하여 antibody-dependent cell-mediated cytotoxicity (ADCC) 반응을 배양 시간이 자님에 따라
Total Green Object Area (μm2/image, x 104) 로 정량화 했습니다. |
|
|
C. |
monoculture 에 비해 co-culture 에서 ADCC로 인해 target cell killing effect 가 증가합니다. isotype control 은 세포 사멸에 전혀 영향을 끼치지 않습니다. |
|
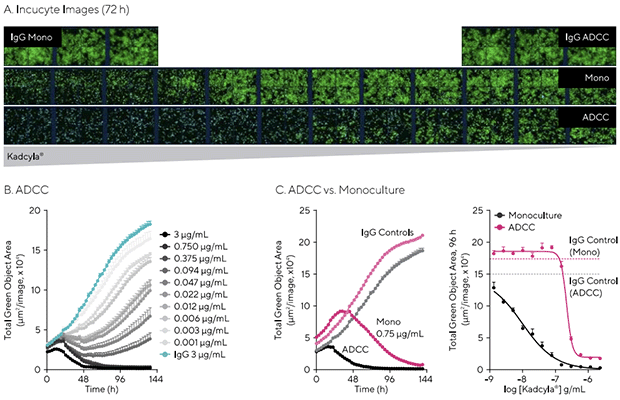
Figure 6. Enhanced Effect of Kadcyla with ADCC
Nuclight Green-expressing AU565 cells were tested as a monoculture or as a co-culture with NK cells in a 1:5 target:effector cell ratio.
Cells were treated with either Kadcyla® or isotype IgG in the presence of Incucyte® Annexin V NIR Dye.
Images (A) depict the concentration-related decrease in green target cells and increase in Annexin V signal (blue, 72 h) in both assay formats.
The effect is enhanced in the presence of NK cells (ADCC).
The time course (B) demonstrates the quantification of this ADCC response.
When directly compared, there is an enhanced target cell killing effect due to ADCC in the co-culture compared to monoculture (C).
The isotype control has no effect on cell death (A, B and C).
All data shown as the mean ± SEM for at least 3 wells.
5. Quantification of NK Activation During ADCC
|
A. |
AU565 와 NK cells 을 1:5 target:effector cell ratio 로 Co-cultures 하면서 Kadcyla 를 처리하고 24시간, 48시간 동안 관찰했습니다.
iQue® Human NK Cell Killing Kit 를 사용하여 NK cells 을 활성화했습니다. 그래프는 Kadcyla® 에 반응한 NK 세포의 CD25 발현을 나타냅니다. |
|
|
B. |
Kadcyla® 에 반응한 NK 세포의 CD16 발현을 나타냅니다. |
|
|
C. |
Kadcyla® 에 반응한 NK 세포가 분비한 IFNγ 를 나타냅니다. |
|
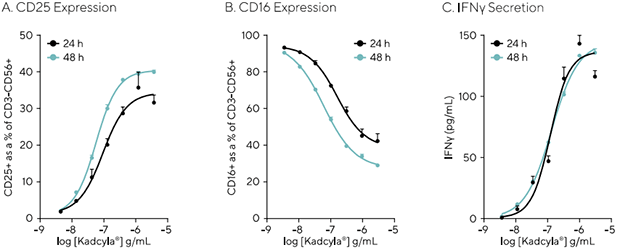
Figure 7. Quantitation of NK Activation During ADCC
Note : Co-cultures of AU565 and NK cells in a 1:5 target: effector cell ratio were set up and treated with Kadcyla® for 24h or 48h.
The iQue® Human NK Cell Killing Kit was used to assess activation of the NK cells.
The graphs show the concentration dependent effect of Kadcyla® on CD25 expression on NK cells (A),
shedding of CD16 (B) and secreted IFNγ levels (C). All data shown as the mean ± SEM for at least 3 wells.
Conclusions
Incucyte® Live-Cell Analysis System 로 Kadcyla®의 상세한 특성화를 명확하게 분석할 수 있습니다.
또한 이러한 측정값들이 biotherapeutics 특성화에 어떻게 적용될 수 있는지를 잘 보여줍니다.
그리고 Incucyte 를 사용하면 Kadcyla®의 다양한 효과를 간단하고 명확하게 시각화하고 정량화할 수 있습니다.
|
|
|
|