| Phone |
| |
| |
| 대표전화 |
1577-7956 |
| 본 사 |
031-457-9187 |
| 대 전 |
042-932-1265 |
| |
|
| Web Site Visitors |
| |
| |
| Today |
656 |
| Yesterday |
1222 |
| Since 2006 |
2,408,489 |
| |
|
 |
|
| 영진코퍼레이션 종합카다로그 |
|
|
| ■ |
Detecting Dark Brown Colloidal Suspensions Using the BeNano 180 Zeta Pro |
Introduction
짙은 색상의 샘플은 종종 강한 빛 흡수를 나타내어, 동적 광산란 (Dynamic Light Scattering, DLS) 테스트 중 산란된 빛의 강도가 감소하고 변동이 발생할 수 있습니다.
이러한 이유로, 보다 정확한 결과를 얻기 위해서는 샘플 희석이 필수적입니다.
본 Application Note 에서는 BeNano 180 Zeta Pro 를 사용하여 빛을 매우 잘 흡수하는 두 샘플의 입자 크기를 조사했습니다.
Instrument
BeNano 180 Zeta Pro 는 671nm 파장의 50mW 고체 레이저를 탑재하고 있습니다. 샘플의 산란된 빛 신호는 90° 또는 173° 각도에서 검출되며,
이를 통해 동적 광산란 (DLS) 측정이 이루어집니다. 강도 변동의 계산을 통해 상관 함수가 도출되며, 확산 계수를 얻을 수 있습니다.
이 확산 계수를 바탕으로 Stokes-Einstein 방정식을 사용하여 샘플의 크기와 크기 분포를 결정합니다.
Experiment
이번 연구에서 두 샘플 모두 갈색을 띠었으며, 이는 강한 빛 흡수 특성을 나타냅니다.
입자 크기 분석은 두 샘플의 원액 (stock solution) 뿐만 아니라 각각 2배, 10배, 100배로 희석한 조건에서 수행되었습니다.
모든 측정은 25°C ± 0.1°C 의 조건에서 90° 및 173° 광학 시스템을 사용하여 수행되었습니다. 각 샘플은 결과의 재현성을 확인하기 위해 세 번씩 측정되었습니다.
Results & Discussion
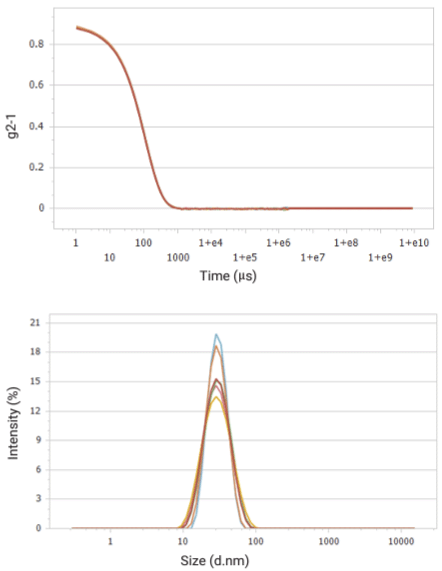
Figure 1. Correlation functions (top) and size distributions (bottom) of 2x diluted sample #1 detected at 90°
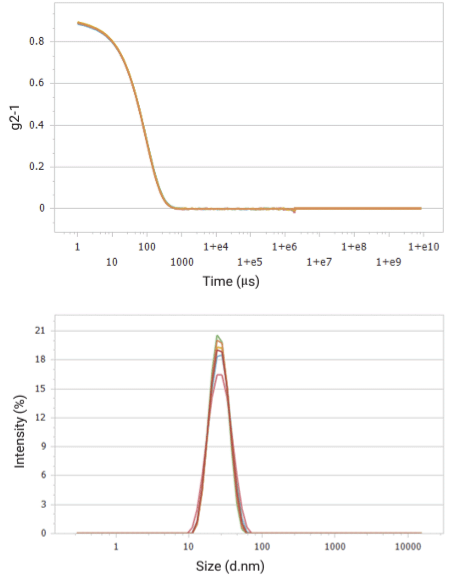
Figure 2. Correlation functions (top) and size distributions (bottom) of 2x diluted sample #2 detected at 90°
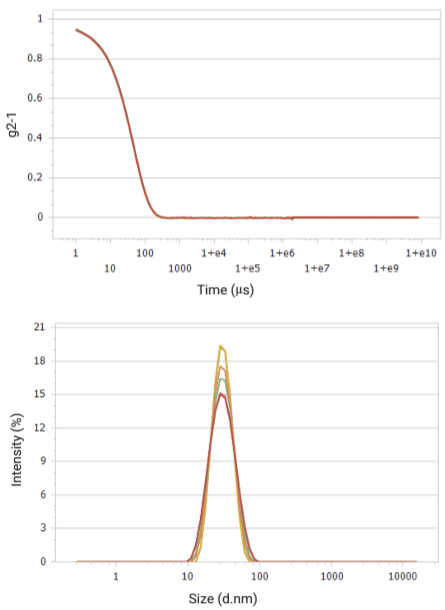
Figure 3. Correlation functions (top) and size distributions (bottom) of 2x diluted sample #1 detected at 173°
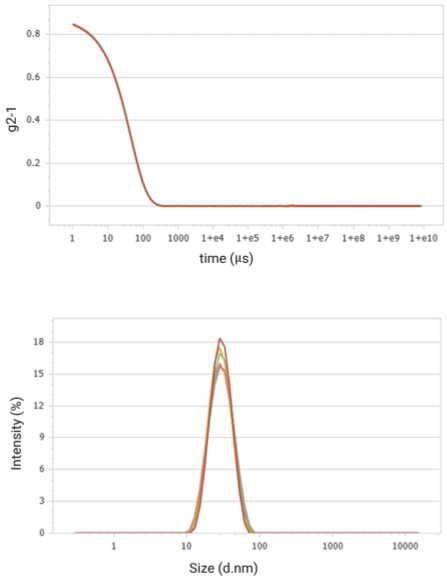
Figure 4. Correlation functions (top) and size distributions (bottom) of 2x diluted sample #2 detected at 173°
Figure 1 부터 Figure 4 는 두 샘플의 다양한 농도와 각도에서 테스트 결과의 우수한 반복성을 보여줍니다.
원액 (stock solution) 은 샘플의 강한 빛 흡수로 인해 90° 광학 각도에서는 검출되지 않았습니다.
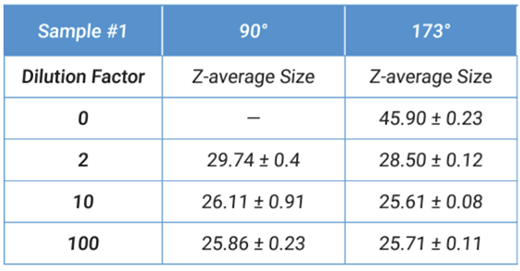
Table 1. Size results of sample #1
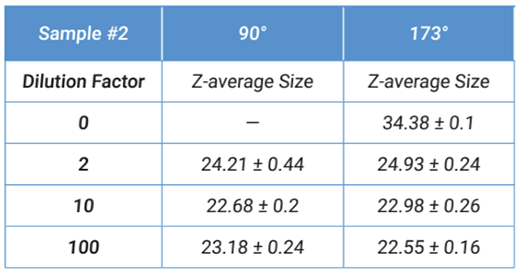
Table 2. Size results of sample #2
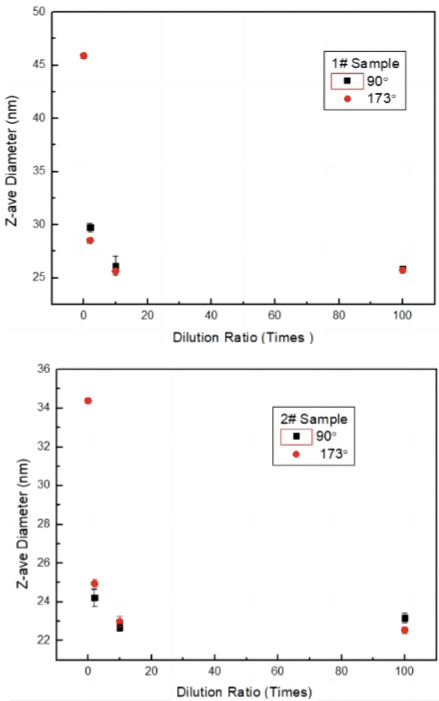
Figure 5. Z-average sizes of sample #1 (top) and #2 (bottom) obtained at different dilution ratios and at different detection angles.
Figure 5 에서는 90° 및 173° 각도에서 측정된 크기 결과가 농도에 따라 감소하는 경향을 보여줍니다.
10배 이상의 희석 이후에는 농도에 따른 크기 변화가 더 이상 관찰되지 않습니다.
90° 와 173° 각도에서의 결과는 희석 조건에서 일관된 일치를 나타냅니다.
농도가 증가함에 따라 입자크기도 증가하는 결과값을 보이고 있는데, 이는 샘플이 빛을 강하게 흡수하게 되면 산란되는 빛의 세기와 fluctuation 이 감소하여 입자크기가 실제보다 더 크게
측정이 됩니다. 따라서 빛 흡수가 강한 샘플의 경우, 희석이 필수적입니다.
입자 크기는 10배에서 100배의 희석 범위 내에서 안정적으로 유지되며, 이는 산란된 빛의 흡수가 거의 없음을 나타내며, 크기 결과의 신뢰성을 보장합니다.
Conclusion
다양한 검출 각도, 특히 173° 와 90° 를 활용한 결과, 고농도에서 173° 의 결과가 실제 값에 더 가깝지 않다는 것이 밝혀졌습니다.
이는 후방 산란 (173°) 의 이점이 탁한 흰색 샘플과 같은 고농도 샘플에서 다중 광산란을 억제하는 데 있기 때문입니다.
그러나 강한 흡수 특성을 가진 샘플의 경우, 후방 산란은 고농도에서 검출 능력을 향상시키지 못합니다.
따라서 사용자들은 기기 사양에만 의존하지 말고, 기기 구성과 검출 각도를 선택할 때 샘플의 특성을 고려하는 것이 좋습니다.
|
|
|
|


